
How to improve your DARWIN's capacity: a practical guide
Puedes leer este artículo en español, haciendo click aquí
Growing assets under management? That's great — you're doing things right. But growth brings a challenge many traders overlook until it hits their investors' returns: divergence and its impact on Capacity.
This guide cuts straight to it — diagnose your situation and take concrete steps before it escalates.
What is capacity and why does it matter?
Capacity is the maximum investment volume your DARWIN can absorb before execution starts to deteriorate. As you grow, the volume Darwinex replicates for your investors grows with you — and that higher volume can show up in two ways:
- Latency: The time it takes from when you execute an order to when replication is complete for investors. Think of it as a health indicator for your flow — the lower, the better.
- Divergence: The difference in pips or points between the price at which you execute and the price your investors get. It can go either way — positive means a better price for investors, negative means worse. The target is to minimise that negative gap.
Divergence is calculated as:
Divergence % = (investor price − strategy price) / strategy price × 1000 (multiplied by −1 if it is a purchase order)
For example: if your buy order is executed at 1.15384 and the investor replica is executed at 1.15389, the divergence is 0.00433%.
Problems typically arise when order sizes exceed a nominal value of 1 million. Above this threshold, negative divergence can begin to systematically subtract returns for your investors.
Step 1: Analyze your current divergence in detail
Before taking action, you need to understand where the problem lies. The section: Investor Divergence from your main account is one of your main tools.
For all the details about it, please refer to the Official Darwinex documentation on investor divergence. Here's a summary of the essentials.
Key sections
1. DARWIN Info: An overview of your key parameters at a glance — target VaR, VaR ratio, invested capital, number of investors, cumulative monthly divergence and average latency. Keep an eye on monthly divergence: if it goes negative and exceeds 0.2% per month, there's work to be done.
![]()
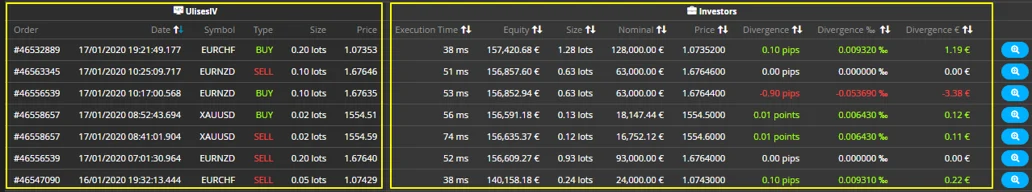
2. Strategy and investors' orders: This is the most detailed section for conducting a deep analysis. For every order you execute, an aggregate order is generated and applied across all your investors.
Here you can see them side-by-side:
- Your execution price
- The price at which the replicated order executed for investors.
- The divergence in pips and in %
- Execution time (latency)
- The nominal volume of the investor's order
Key Charts:
- Divergence %: Green bars (favorable) and red bars (unfavorable) for each order.
Look for no systematic pattern of red bars. - Execution time: A white line tracks latency per order. Recurring spikes at the same times? That's a warning sign.
- Leverage: Investor leverage on each order.
- Nominal volume: The size of each replicated order. Watch for large orders lining up with divergence spikes.
Practical tip: Download the full CSV (select "By date range" — up to 12 months of data) and cross-reference it with your trading times. Consistently worse divergences at 9:00, 10:00 or 14:30? You've got a pattern — and a clear starting point.
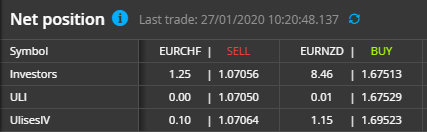
3. Net strategy and investors' positions Real-time net open positions — yours and your investors' — along with their respective VWAPs. If any symbol shows in red, there's an inconsistency between your position and your investors' that needs immediate attention.
Understanding deals and fills
More instructive: Each investor order can be divided into deals (fragments Darwinex sends to the liquidity provider) and fills (the partial execution of each deal). The Div. VWA pip field tells you exactly how much each fill contributes to the order's total divergence.
Example: Take an order of 58.33 lots with a total divergence of 8.43 pips:
- Deal 1 (50 lots): contributes 6.16 pips
- Deal 2 (8.33 lots): contributes 2.28 pips
If Deal 1 is driving almost all the divergence, the issue lies in the size of that first partial execution — not the order overall. That level of detail tells you exactly what to adjust.
Tip 1: Don't operate exactly "on the hour"
This is one of the most common mistakes in algorithmic trading — and one of the most impactful. When your algorithm is set to enter at the exact open of a candlestick, you're not alone. Thousands of other traders are firing the same instruction at the same moment, and you're all competing for the same execution.
Why does it get worse as the timeframe increases?
The higher the timeframe, the more traders are using that candle as a reference. A 1-minute open only attracts traders on that timeframe. A 1-hour open pulls in everyone — traders on 1-hour, 30-minute, 15-minute and 5-minute charts alike.
The solution: Introduce a delay into your algorithm's logic. A good starting point is waiting 5 seconds after the candle opens before placing the order.
Example: If your system runs on 1-hour candles and the buy signal is confirmed at the 2:00 PM close, schedule execution for 2:00:05 PM instead of 2:00:00 PM. A small tweak that can meaningfully reduce divergence on those orders.
Note: For futures-linked assets (indices, commodities), sensitivity is lower — 1–2 seconds may be sufficient. For FX, 5 seconds is more relevant.
Tip 2: Analyze the toxicity of your operations
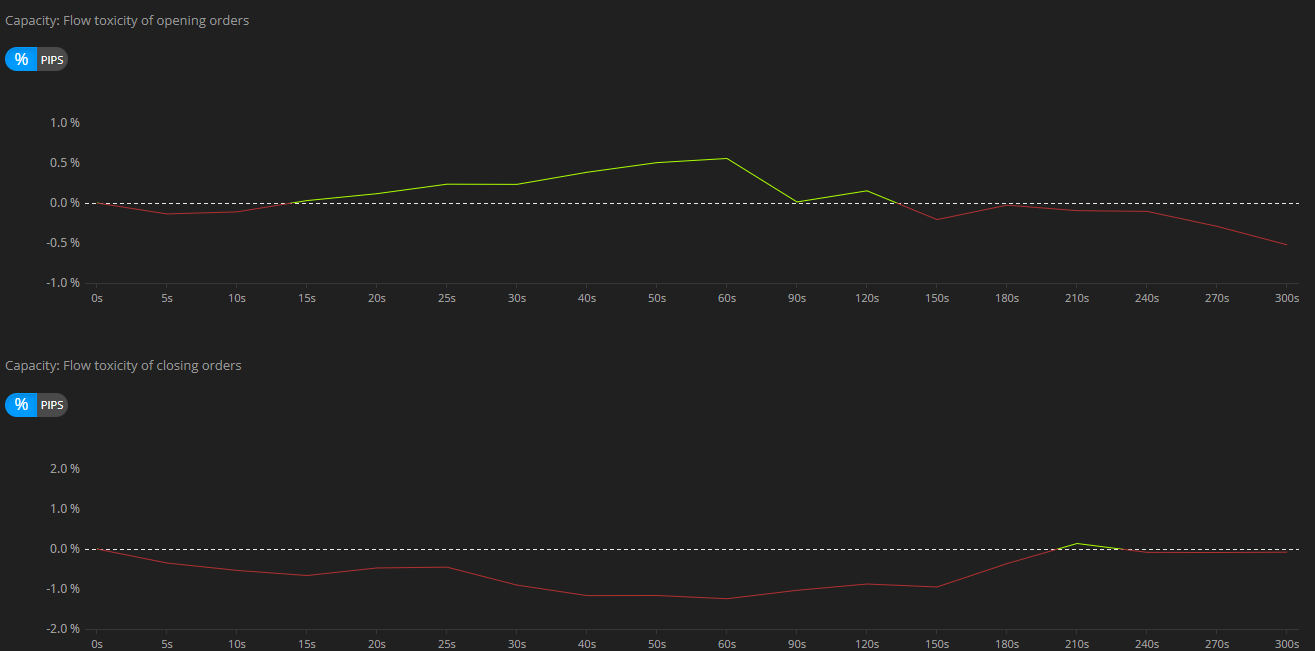
Darwinex has a toxicity tool built to answer a simple but powerful question: what performance would my DARWIN have achieved if each order had entered X seconds later?
It generates a curve showing the optimal delay for your strategy — separately for opening and closing orders.
Example: If the curve shows a 5-second delay would improve monthly performance by 0.3%, that's a change worth making — better capacity, better profitability. If the curve drops quickly though (meaning the delay costs you too many signal pips), fractional trading is likely a better route than adding delays.
You'll find these charts in the Capacity attribute of your DARWIN.
Tip 3: Implement order splitting
Order splitting involves dividing a large order into several smaller ones, each sent with a slight time lag between them. By reducing the hit on the order book, you improve execution efficiency and bring divergence down for investors.
How to do it without increasing leverage?
This is the critical point. Fractioning only makes sense if you can divide the lot without changing the overall risk of the trade.
- Favorable case: If you trade with 1 lot, you can send 2 × 0.5 lots with a 2-3 second difference. The total risk is the same, but the impact on the order book is less.
- Unfavorable case: You're already trading with the minimum lot size (0.01 lots) → to split your trades you would have to send 2 × 0.01, which doubles the volume and leverage. That's not splitting your trades, it's doubling your exposure.
If you're in the unfavorable situation, the solution involves increasing your account equity until you have room to split your trades. For example, if you increase your account balance from €10,000 to €20,000, your reference lot size increases proportionally by two times, and you can then divide it.
Where to begin: opening or closing?
In most cases, divergence problems cluster at order opens — that's where algorithmic traders compete most aggressively for price. That said, fractional trading is usually easier to implement on closes first, since it doesn't require changing your signal entry logic.
Splitting closes alone may improve divergence — but how much depends on your specific strategy. Analyse before committing to a change.
The trade-off you need to know
More fractional trading generally improves divergence for your investors — but it can come at a cost: slight losses in signal efficiency, meaning entries and exits at prices marginally different from your backtest. The right balance is different for every strategy. Capacity isn't the only goal here. If fractional trading brings your annual return from 10% to 8% but triples your capacity, that trade-off makes sense. If it drops you to 6%, it likely doesn't.
Tip 4: Monitor your latency as a health indicator
Latency is more than a technical metric — it's a barometer of your order flow. Low, stable latency signals that your trades are reaching the market during periods of normal liquidity. High latency or recurring spikes signal the opposite.
Manual traders typically see lower latency because they tend to trade during calmer, more stable periods. Algorithmic traders usually see higher latency — by design, they enter the market at its most active, right when the trade signal fires.
Warning signs in latency:
- Recurring spikes at specific times (European and American session start times, macro publications)
- Peaks at the exact beginnings of the candle, as explained in Tip 1
- Average latency that increases over time as invested capital increases
If you're seeing high latency but divergence looks fine for now, don't take comfort in that. Divergence can be circumstantial — the last 100 orders may simply have gone your way by chance. Latency is the leading indicator. Act on it early.
Tip 5: Adapt your strategy according to the type of asset
Not all markets react the same way to volume. There is a relevant difference between:
Futures-linked assets: indices, commodities, stocks and ETFs.The reference price is the futures contract or the quoted security, a centralized and highly liquid market. A 1-2 second delay is usually sufficient to avoid congestion at the beginning of each candlestick.
FX: When trading against prime brokers that offer slightly different feeds, execution is more sensitive to the exact timing. Here, the 5-second delay is more relevant, and the toxicity tool tends to show more pronounced differences between entering "on the dot" versus with a delay.
Tip 6: Download the data and look for patterns
All the above theory is only valid if you compare it with your actual data. The downloadable CSV file from the Investor Divergence section (available by date range, up to 12 months) contains, for each order:
- MetaTrader ticket number (to correlate with your platform)
- Exact date and time of execution
- Symbol, type (buy/sell), size
- Price of your order and price of the replica
- Divergence in pips and in %
- Execution time (latency)
- Total equity of investors at that time
- Investor order nominal value
With this data, you can perform a simple analysis in Excel or with the help of AI, seeking answers to questions such as:
- Do my orders executed at the beginning of a 5-minute candle (XX:00, XX:05, XX:10...) have worse divergence than those executed at other times?
- Do orders with a nominal value of over €500,000 have significantly worse divergence than smaller orders?
- Is the negative divergence concentrated at the open or the close?
- Are there any specific symbols where the divergence is consistently worse?
Each of these questions has a specific action associated with it: delay, splitting, changing operating hours, or reviewing the problematic symbol.
Summary: Where to begin
If you don't know where to start, this is the recommended order:
- Download the CSV From the last 3-6 months, calculate your average divergence per hour. If there are spikes at the beginning of candles, that's your first adjustment.
- Check the toxicity tool (Capacity attribute) of your DARWIN to find out if a 5-second delay would improve your performance without noticeable impact on the signal.
- Evaluate whether you can divide. Check which lots you are trading with and whether you have room to split them without increasing leverage.
- Monitor latency on a regular basis, not just when there's a problem. It's the early warning system that gives you time to act.
For a complete guide to all metrics available on the platform, see the Darwinex's official article on the Investor Divergence section.
Thanks for reading,
The Darwinex Team
*Trading involves risk. The content of this article is for informative purposes only and is not to be construed as financial and/or investment advice.